<b>Gold</b> Silver Ratio is not Confirming Lower <b>Prices</b> in <b>Gold</b> and Silver |
- <b>Gold</b> Silver Ratio is not Confirming Lower <b>Prices</b> in <b>Gold</b> and Silver
- <b>Gold's Price</b> Plunge, U.S. Dollar and CCI :: The Market Oracle <b>...</b>
- Long Cycles And Trend Changes: <b>Gold Price</b>, Dollar, S&P500 | Gold <b>...</b>
| <b>Gold</b> Silver Ratio is not Confirming Lower <b>Prices</b> in <b>Gold</b> and Silver Posted: 03 Sep 2014 04:36 PM PDT

All that can be said is, Well, they haven't busted down old support levels yet and sunk toward the earth's core. The GOLD PRICE rose away from the lower line of the downtrending range, but not far enough to rise back above the uptrend line from the December low. I read that yesterday saw extra high volume at odd times, which leads to the conclusion the Nice Government Men or their egg-sucking dog lackeys were slamming gold again. But they are vultures, they prey on the sick, so if gold were more robust right here it could shake off that attack. We will see whether gold does or not. If not, it might once again visit $1,180. The SILVER PRICE, at 1910.8 cents, doesn't excite anyone but those who recognize what a bargain it is here. Today's tiny rise changed nothing. Silver is still sliding down that downtrend line from the August 2013 high. Oddly enough, the MACD is trying to turn up.
So even though silver and gold look peaked, other indicators show some life. Stocks were mixed. Nasdaq and Nasdaq 100 dropped a leetle, S&P500 lost 1.56 (0.08%) to 2,000.72. Dow gained a nothing 10.72 (0.06%) to 17,078.28. In fact, the S&P500 posted the first half of a key reversal today by reaching into new high ground but closing lower than yesterday. As always, that needs confirming a second day by a lower close. Dow in gold backed off 0.24% to 13.44 oz (G$277.83 gold dollars). Dow in silver rose a tiny 0.04% to 890.00 oz (S$1,150.71 silver dollars, knocking at the June high, 892.99 oz (S$1,154.57). US Dollar index fell 14 basis points (0.17%) to 82.87, giving up most of yesterday's gains. It remains overbought so does today make yesterday a mere fluke, a spike without follow-through? If I could answer that question with certainty I'd be sippin' wine on the Riviera. I'm going to guess that that overbought burden will bring it down, however. Yen rose today 0.28% to 95.42. Chart pattern is a cascading fall with a gap, and island after the gap, and another gap down. That generally paints a completed pattern and reversal, so the yen is set up for a rally, at least to work off some of that overboughtness. Euro rose 0.13% to $1.3151 but still inspires no confidence. Like the yen, the overbought euro is inline for at least a little rally. Ten year Treasury Note yield today tried to climb toward its 50 DMA but was slapped back. At hits high it reached 2.457%, but ended the day at 2.41%, down 0.37% from yesterday's close. All the same, it is trying to climb. Aurum et argentum comparenda sunt -- -- Gold and silver must be bought. - Franklin Sanders, The Moneychanger © 2014, The Moneychanger. May not be republished in any form, including electronically, without our express permission. To avoid confusion, please remember that the comments above have a very short time horizon. Always invest with the primary trend. Gold's primary trend is up, targeting at least $3,130.00; silver's primary is up targeting 16:1 gold/silver ratio or $195.66; stocks' primary trend is down, targeting Dow under 2,900 and worth only one ounce of gold or 18 ounces of silver. or 18 ounces of silver. US $ and US$-denominated assets, primary trend down; real estate bubble has burst, primary trend down. WARNING AND DISCLAIMER. Be advised and warned: Do NOT use these commentaries to trade futures contracts. I don't intend them for that or write them with that short term trading outlook. I write them for long-term investors in physical metals. Take them as entertainment, but not as a timing service for futures. NOR do I recommend investing in gold or silver Exchange Trade Funds (ETFs). Those are NOT physical metal and I fear one day one or another may go up in smoke. Unless you can breathe smoke, stay away. Call me paranoid, but the surviving rabbit is wary of traps. NOR do I recommend trading futures options or other leveraged paper gold and silver products. These are not for the inexperienced. NOR do I recommend buying gold and silver on margin or with debt. What DO I recommend? Physical gold and silver coins and bars in your own hands. One final warning: NEVER insert a 747 Jumbo Jet up your nose. | ||||||||||||||||||||||||||||||||||||||||||||||||||||||||||||||
| <b>Gold's Price</b> Plunge, U.S. Dollar and CCI :: The Market Oracle <b>...</b> Posted: 03 Sep 2014 12:35 PM PDT Commodities / Gold and Silver 2014 Sep 03, 2014 - 09:35 PM GMT By: P_Radomski_CFA
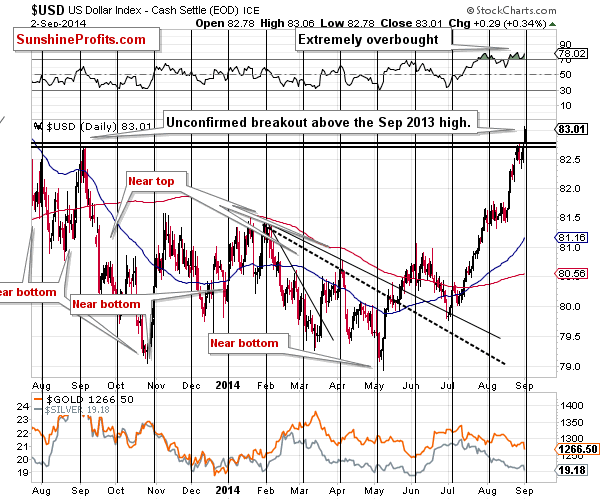
The precious metals sector moved sharply lower yesterday – in tune with its medium-term trend. The decline was to a large extent connected with the breakout in the USD Index. It seems that it is the U.S. dollar that will determine the short-term moves in PMs and miners in the coming days and in today's alert we focus on this relationship. The CCI Index seems to be in a particularly interesting position as well and this is something that gold & silver traders should be aware of. Let's start with the USD Index chart (charts courtesy of http://stockcharts.com).
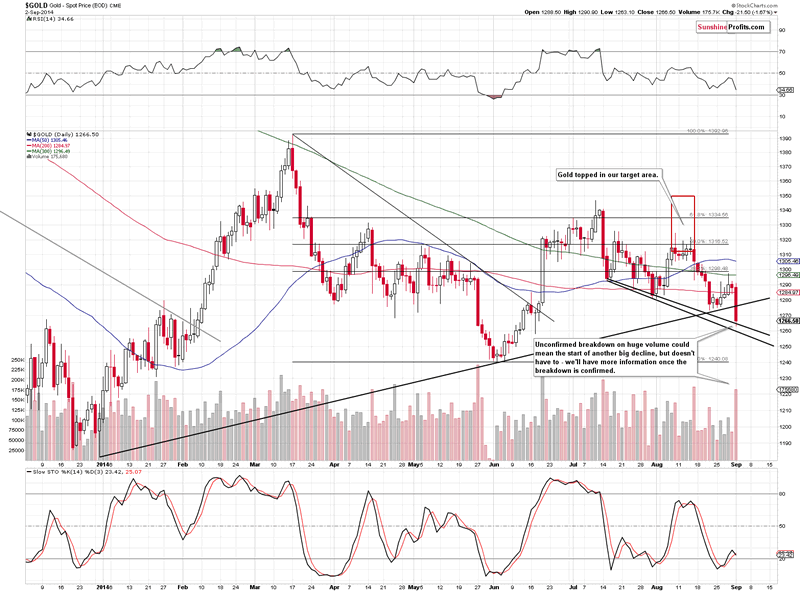
The USD Index moved higher once again – this time it managed to move above the Sep. 2013 high. The RSI indicator suggests an extremely overbought condition and the cyclical turning point is upon us. The combination of the above suggests that a corrective downswing has become very likely. The breakout indeed materialized yesterday, but it has not been confirmed yet (only 1 daily close above the Sep. 2013 high and we would like to see 3 of them before saying that the move is confirmed), which means that this makes the situation only a little more bullish. The combination of these factors seems more important than the unconfirmed breakout, so it seems quite likely that we will see a move lower shortly. In yesterday's Forex Trading Alert we commented on the possible reversal in the currency markets this week: Please note that we will have a decision or at least more information regarding the European QE on Thursday - perhaps this will be the day when currencies reverse their direction for some time. We will keep our eyes open and report to you accordingly. It could be the case that even if the decision that will be made on Thursday is bullish for the USD Index (big QE in Europe), we could see a "sell rumor but buy the fact" type of reaction. In other words, given the significantly overbought situation in the USD Index and the proximity of the turning point, we could see a reversal no matter what the officials say on Thursday. The unconfirmed breakout in the USD Index translated into an unconfirmed breakdown in gold.
The decline in gold took place on huge volume which is a bearish factor, but, just as it was the case with the USD Index, until we see a confirmation of the breakdown, we shouldn't get too excited. Yes, in our opinion the medium-term trend remains down, so the surprises will be to the downside, but at this time it's not that certain that the decline has already begun. The breakdown (below the previous lows and the rising medium-term support line) is not confirmed at this time and gold hasn't moved below the declining support line (the upper of them, based on the daily closing prices). In other words, if the USD Index corrects, then we will be likely to see gold move higher in the short term. If, given the correction, gold stays above the rising support/resistance line, we will have a good possibility that the next big downswing will already be underway and it will probably be a great time to enter a short position. While we're at discussing the gold-USD link, we were asked if there [was] a chance that we could see a month long rally in gold with the likelihood of a falling dollar as we [were] at the cyclical turning point. In our opinion such possibility exists, but yesterday's big-volume decline made it more probable that we will see a rather limited upswing. If gold soars more than $100 or so and mining stocks also rally, then it could change the medium-term picture to bullish. At this time, however, the volume suggests something opposite – we have been seeing higher volume with lower prices and low volume with higher prices. We will be monitoring the markets for signs of significant strength and report to you if we see them. For now – we think the medium-term remains bearish.
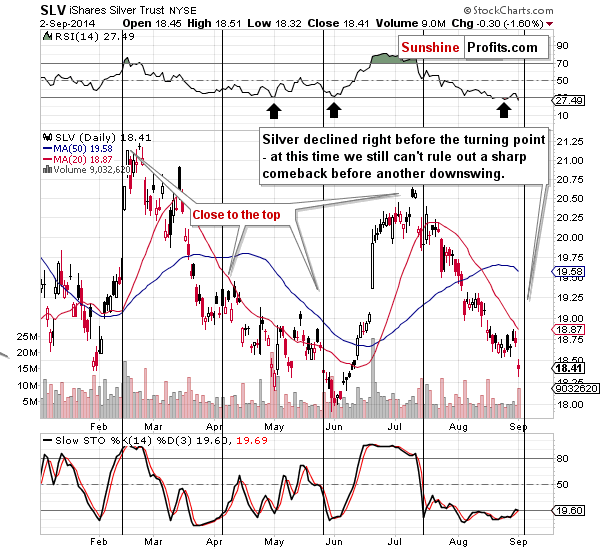
Commenting yesterday's SLV chart we wrote that "we [could] expect the volatility to increase in the coming days based on silver's cyclical turning point" and we didn't have to wait long for this to become reality. However, the move lower might not be the thing that was likely to take place based on the turning point – since silver is still before it, we could actually see a sharp upswing based on it. In fact, it still seems quite likely given the situation in the USD Index. Also, please note that the RSI indicator is once again oversold, which has previously meant that we were at a local bottom or a very close to one. Our yesterday's comments remain up-to-date: The most interesting thing about the turning points in the USD and silver is that the one in silver is several days behind the one in the dollar. This paints a picture in which the USD Index declines first, causing silver and the rest of the precious metals sector to rally, perhaps sharply, but then silver's turning point "kicks in" and metals and miners reverse and start declining. Let's keep in mind that silver tends to outperform in the final part of a given upswing, so we could see a jump in the price of the white metal right before a downturn. Naturally, there are no guarantees that the above scenario will be realized, but it seems quite likely in our view. What can we infer from the mining stocks chart?
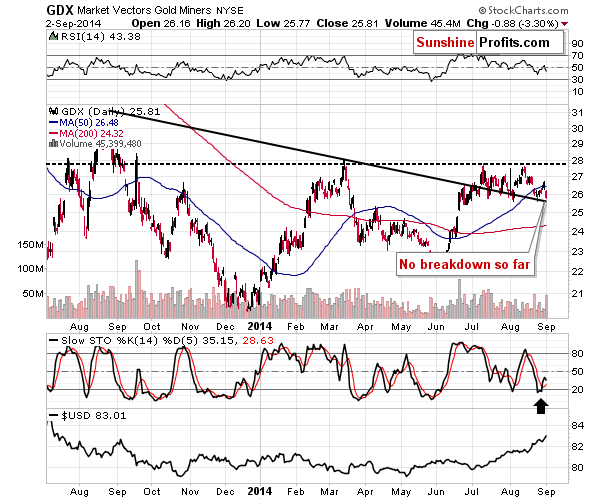
Not much. The decline hasn't taken mining stocks below the declining support line, which means that there has been no breakdown. Therefore, the situation hasn't really changed based on yesterday's decline. We could still see some short-term strength, based mainly on the buy signal from the Stochastic Indicator. Similarly, to what we've seen in gold, the volume on which miners rallied last week was small, suggesting that this rally was just a temporary phenomenon. Before summarizing, we would like to reply to another question that we have just received and we would like to provide you with one additional chart. We were asked about our best approximation of the HUI Index if Dow was at 17,000 and gold at $1,100. Of course, there are no guarantees, but our best bet at this time is 150. The 17,000 assumption about the Dow doesn't change much, as the HUI to gold ratio managed to slide in the past 2 years despite the rally in the former (despite short-term upswings, that is). It seems quite likely to us that when the precious metals sector finally bottoms, the HUI to gold ratio will move to its 2000 and 2009 lows – close to the 0.13 level. Multiplying this by 1,100 leaves us with 143 and 150 is the strong support that is closest to this level.
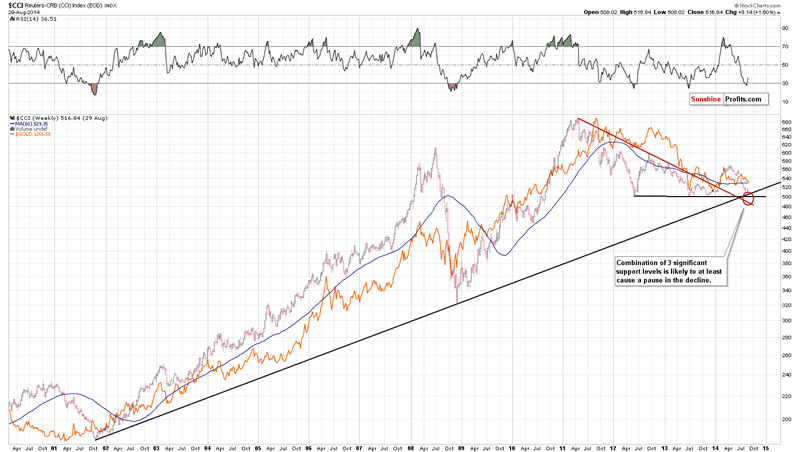
The CCI Index (proxy for the commodity sector) has just moved to the major, long-term support and stopped the decline at this level. That's the upper part of our target area for this index – the one that we featured weeks ago. The commodity sector is likely to at least take a breather before declining once again, and this is a short-term bullish sign for gold as well. Summing up, while the medium-term has been down, the short-term outlook for the precious metals sector seems rather favorable based on the extremely overbought situation in the USD Index. The latter is likely to correct sooner rather than later based i.a. on its cyclical turning point and it's quite likely that it will cause a move higher in PMs and miners. To summarize: Trading capital (our opinion): No positions Long-term capital (our opinion): No positions Insurance capital (our opinion): Full position You will find details on our thoughts on gold portfolio structuring in the Key Insights section on our website. As always, we'll keep our subscribers updated should our views on the market change. We will continue to send them our Gold & Silver Trading Alerts on each trading day and we will send additional ones whenever appropriate. If you'd like to receive them, please subscribe today. Thank you. Przemyslaw Radomski, CFA Founder, Editor-in-chief Tools for Effective Gold & Silver Investments - SunshineProfits.com * * * * * About Sunshine Profits Sunshine Profits enables anyone to forecast market changes with a level of accuracy that was once only available to closed-door institutions. It provides free trial access to its best investment tools (including lists of best gold stocks and best silver stocks), proprietary gold & silver indicators, buy & sell signals, weekly newsletter, and more. Seeing is believing. Disclaimer All essays, research and information found above represent analyses and opinions of Przemyslaw Radomski, CFA and Sunshine Profits' associates only. As such, it may prove wrong and be a subject to change without notice. Opinions and analyses were based on data available to authors of respective essays at the time of writing. Although the information provided above is based on careful research and sources that are believed to be accurate, Przemyslaw Radomski, CFA and his associates do not guarantee the accuracy or thoroughness of the data or information reported. The opinions published above are neither an offer nor a recommendation to purchase or sell any securities. Mr. Radomski is not a Registered Securities Advisor. By reading Przemyslaw Radomski's, CFA reports you fully agree that he will not be held responsible or liable for any decisions you make regarding any information provided in these reports. Investing, trading and speculation in any financial markets may involve high risk of loss. Przemyslaw Radomski, CFA, Sunshine Profits' employees and affiliates as well as members of their families may have a short or long position in any securities, including those mentioned in any of the reports or essays, and may make additional purchases and/or sales of those securities without notice.
© 2005-2014 http://www.MarketOracle.co.uk - The Market Oracle is a FREE Daily Financial Markets Analysis & Forecasting online publication. | ||||||||||||||||||||||||||||||||||||||||||||||||||||||||||||||
| Long Cycles And Trend Changes: <b>Gold Price</b>, Dollar, S&P500 | Gold <b>...</b> Posted: 04 Sep 2014 11:55 AM PDT Several markets seem over-extended and about to reverse their current trends. S&P 500 Index: It bottomed in March 2009 about 670 and is currently about 2,000. The S&P, thanks to QE, ZIRP, Central Bank purchases, and who knows what other contrivances, has levitated to the magical 2,000 level. Will it go higher? Dollar Index: The dollar index, currently about 83, is well below its high in 2002 at about 120. However it is also well above its 2008 low around 72. Will capital flows into the US and the fear trade continue to levitate the dollar? Gold: Gold prices peaked in August 2011 about $1,920 and today gold sells for about $1,270. However, prices have retreated to 2010 levels but are still far above the lows in 2001 at about $255. Is gold ready to rally? What about cycles?
S&P 500 Index: Consider the following graph of monthly prices for 30 years. The blue vertical lines are drawn every 81 months – about 7 years. Note the highs in 1987, 1994, 2000, 2007, and 2014, and note the current "over-bought" condition of the S&P as indicated by the MACD and TDI indicators. This graph does not conclusively inform us that the S&P is ready to correct, but it does indicate that the S&P could be forming a 7 year cyclic top with a low due perhaps in 2016 – 2019. Dollar Index: Consider the following grAph of monthly prices over nearly 30 years and the vertical blue lines every 75 months. Note the alternating high – low pattern with a high in 1989, low in 1995, high in 2002, low in 2008, and possible high in 2014. The dollar index might move higher and take longer but it could be topping now. The monthly TDI is modestly over-bought and the weekly (not shown) is strongly over-bought. The dollar index could be peaking. Gold: The gold chart shows 20 years of prices with Blue vertical lines every 56 months. Note the lows in 1999, 2004, 2008, and 2013. Gold appears to have made a long term low in 2013 – 2014 and has built a base from which another rally should appear. The MACD and TDI indicators are oversold and indicate strong rally potential. Further, my long-term empirical gold model indicates that current gold prices are too low by about 20%, which will provide a "tail-wind" for gold prices over the next several years, independent of massive QE, more wars, dollar weakness, and economic slumps that create even more unpayable debt. Given the troublesome economic conditions in the world and potential expansion of war in the Ukraine, Iraq, Syria, North Africa, and elsewhere, there is considerable risk that the S&P could fall substantially and a strong probability that gold will rally. Furthermore, there is a growing global movement away from the use of the dollar in global trade, led by China and Russia, and that bodes poorly for long-term dollar strength, particularly as cycles indicate a potential top due in 2014. A fall in the dollar would likely be accompanied by a rise in gold prices. Markets can move farther and take longer than most people expect, but it is certainly time to consider that the S&P is quite high and ready to reverse its five plus year uptrend, and that gold is too low and set to reverse its three year downtrend. Additional Reading: Gary Christenson | Deviant Investor NEW: Check Gary Christenson's brand new book site at GEChristenson.com |
| You are subscribed to email updates from gold price - Google Blog Search To stop receiving these emails, you may unsubscribe now. | Email delivery powered by Google |
| Google Inc., 20 West Kinzie, Chicago IL USA 60610 | |


 Briefly: In our opinion no speculative positions in gold, silver and mining stocks are now justified from the risk/reward perspective. However, day-traders might consider a small speculative long position in silver.


0 Comment for "Gold Silver Ratio is not Confirming Lower Prices in Gold and Silver"