Gold Weekly Nov 25-29/2013 |
| Posted: 24 Nov 2013 09:50 PM PST Monthly Whether we will get upward retracement and possible BC leg of larger AB=CD down move or not – that was our question for previous months and not much has changed here by far. And looks like bullish sunshine was not as long as it could. Market has moved and closed below October lows. Fundamental situation and CFTC data stand not in favor of possible appreciation. Seasonal trend is still bullish, but it is not always lead to growth. Sometimes, it could just hold depreciation and now we see something of this kind, since market stands in some range since August. Our previous analysis (recall volatility breakout - VOB) suggests upward retracement. As market has significantly hit oversold we've suggested that retracement up should be solid, may be not right to overbought, but still significant. Take a look at previous bounces out from oversold – everytime retracement was significant. Thus, we've made an assumption of possible deeper upward retracement that could take a shape of AB=CD, and invalidation for this setup is previous lows around 1170s. If market will pass through it, then, obviously we will not see any AB=CD up. And now, as market has broken through 1250, next target is precisely previous lows around 1180. In fact this will be the last chance for possible upward bounce, if, say, market will shows something like double bottom. Price is not at oversold right now and not at major support, so really bearish market should reach previous lows level. 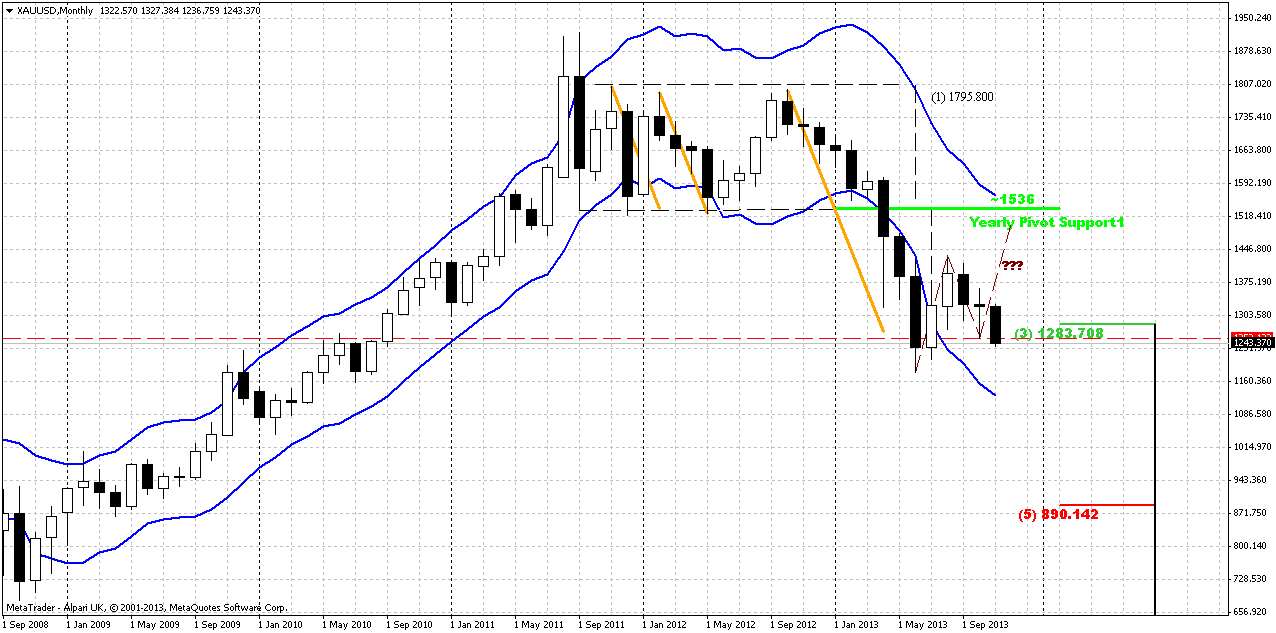 Weekly Last week has clarified situation very well. Trend has turned bearish and market has erased potential bullish stop grabber. This moment by itself shows bearish sentiment. Previous week was solid move down, price has passed through major 5/8 resistance and has closed near the lows. Another significant moment is that market has closed below MPS1. This tells that we can't treat current move as retracement anymore. Also, interestingly that after such solid move down right from 1810 area – market has shown only small major 3/8 retracement although was strongly oversold. As market is not at oversold right now, it has good chances to proceed lower. Currently I do not see many patterns here. The short term one that we probably will focus on is AB-CD that has target precisely at previous lows. Second, this pattern could shift later to Butterfly "Buy" if it will break through 1180. 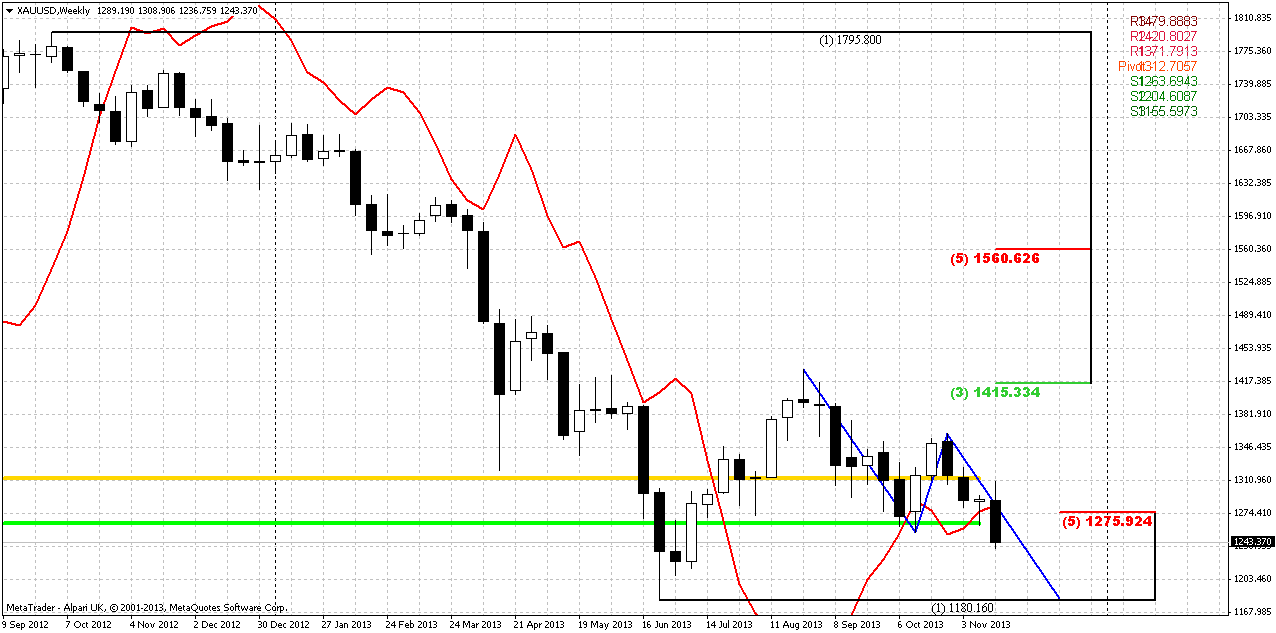 Daily On daily time frame trend is bearish as well, and again – price is not at oversold. Here we see the same AB-CD as on weekly – market has reached minor 0.618 target and clear out previous lows. These lows are not as significant as, say, 1180 lows, since they in fact (I mean 1250) just a reaction on major 5/8 support. But still to hold absolute bearishness, I prefer to see retracement only to 1284-1289 level – combination of 3/8 Fib resistance and WPR1. First is because market is not at oversold and has hit just minor target – the less retracement will be all the better. Besides, I do not want see if bearish market will pass through WPR1 – this will point on some hidden weakness, even if we will not find any weakness signs on surface. But theoretically, if even price will retrace right up to 1311-1313 K-resistance area and overbought – that will be acceptable, but it should not go any further. If it will – this will be too much for retracement in current circumstances. Thus, two levels to watch for potential sell entry – 1284-1289 and 1311-1313 K-area. But as market already has pass through major resistance and 1250 lows, hit 0.618 target and holds there – I do not want to say that any retracement will definitely happen. It could, and if it will – we know what levels to watch for. If it will not – then we will have to prepare different trading plan on Tuesday. Also, guys, here we can't talk about DRPO or B&B, because recent retracement up was greater than 3/8 level. It means that most part of steam was out of the pot. 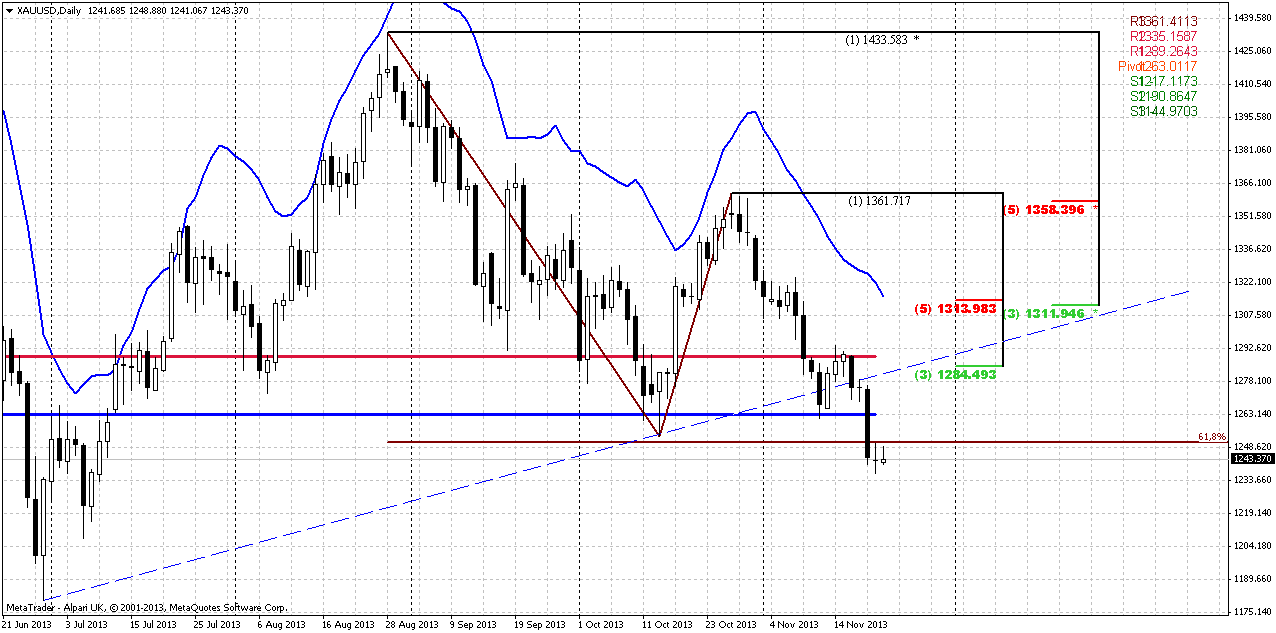 4-hour Here we have butterfly, but it is not very reliable. Mostly by 2-3 reasons. First is very small right wing retracement. Typical butterfly level should be 0.618 – 0.88, but here it is 0.382 at best. This tells about strength of the bears. Second reason – too fast move to the 1.618 point, long nasty candle. When butterfly has such finish it has more chances to fail and carries a lot of risk, that made it not very reliable. Finally, third reason, but it stands not particular with butterfly. Take a look how market response on completion point – by no means, curious right. It seems like somebody has put someting heavy on the price and it can't show even small bounce, very tight action. Combining that with MACDP we could get a bearish dynamic pressure, since trend has turned to bullish but price action is not. This overall situation makes shy chances on possible bounce even smaller. On hourly chart I also do not see any bullish signs or patterns right now. This makes me think that we really could get continuation without bounce, but lets do not be too hasty. If it really will be the case – we will try to enter on small bounce somewhere between 1250 and 1180 level... 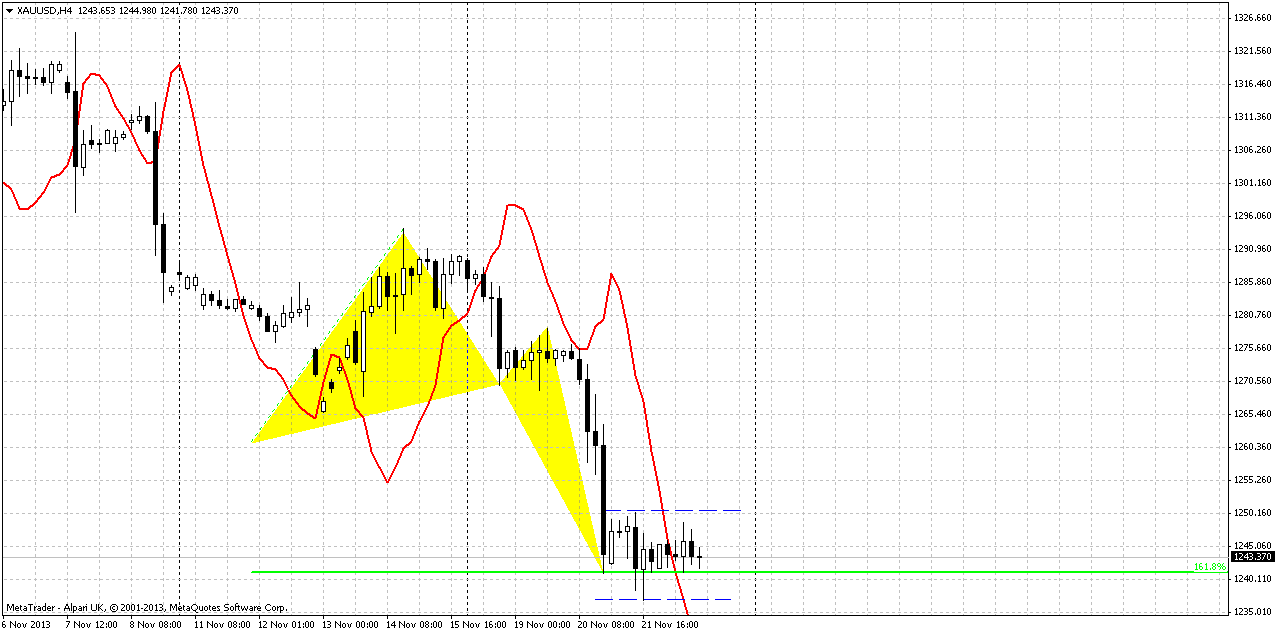 Become an XM IB or Affiliate Partner today and start earning commissions from all the trading activity of the clients you referred to XM. The Advantages of Promoting XM: The Highest Conversion in the Industry Ability to transfer funds between IB account from/to client account No limits on how much you can earn No limits on how much you get paid every month Fastest and most reliable IB payouts Transparent reporting and detailed statistics Account Managers in more than 18 languages Leverage up to 1:888 for your Clients Low Minimum Deposit for your Clients Multiple Deposit Options for your Clients Monthly Timely Payments Tailor-Made Solutions No Fees to Start Multiple Platforms to Promote Flexible Commission Rates Unlimited Banners and Artwork Nonstop Promotions for your Clients The Partner Promotion for 2013 Offers
 Get paid to trade Gold in 3 easy steps. 1. Open your account HERE 2. Send me your MT4 trading account number and email address 3. Send me your Paypal or Moneybookers account number If you do not have a Paypal or Moneybookers account, please click on one of the links below to open your free account today. Moneybookers Paypal You will be paid $10 per standard lot of Gold traded and all payments will be made by the 25th of each month.  thelordoftruth@gmail.com  The Gold Price & Trend Predictions blog made for gold traders to find good news and to provide the traders with daily price predictions and to learn how to trade the Forex Market for free.Just pure learning! It will be of great fun.You can judge by yourself the quality of information that I will be giving you in my blog. Welcome to my blog where you can learn how to trade the Forex Market for free.The material is all created by myself and not copied from anywhere. There is a lot yet to come since there is a lot that you need to learn, and there is a lot that I need to share with you! So please just be patient – it will be worth it.You can judge by yourself the quality of information that I will be giving you . So just go now and start learning! Below is a quick guide of how this website is structured, so you can find what you are looking for fast. Remember that I update the pages every day so either check back often. In this section you will find quite a long article of what Forex is all about. If you are a beginner, this is a must read. It explains in detail what is required to start trading, what you should do and not, typical traps to avoid as a beginner and a lot of valuable information which you as a beginner must digest and learn prior opening any Forex account with real money. In this section you will find your road map on how to become a real successful trader couple of months as from today. In this section you will know the 3 major areas – Technical Analysis, Fundamental Analysis and Trading Physcology. In this section you will find a gold mine of information about the technicalities of Forex. We will start from the very basics covering all the Forex jargon words which you will be hearing every day and we will be taking you up to the level required to finally learn to trade like a pro – technical analysis, also found in this section. In this section you will see the tips that will help you stay away from crap forex products, which unfortunately the Forex market is invaded with. This section has a very detailed article on how to avoid being scammed in this ruthless world of Forex. I will explain in detail six tips that you need to look for prior purchasing any products. Even though most of the time you may claim your money back,the time wasted is never returned. You should have used that time to learn how to trade! Read it!     YOU SHOULD NOT TAKE ANY MATERIAL posted on this BLOG AS RECOMMENDATIONS TO BUY OR SELL GOLD OR ANY OTHER INVESTMENT VEHICLE LISTED. Do your own due diligence. No one knows tomorrow's price or circumstance. I intend to portray my thoughts and ideas on the subject which may s be used as a tool for the reader. I do not accept responsibility for being incorrect in my speculations on market trend. King Regards |
| You are subscribed to email updates from Follow The XM Bull To stop receiving these emails, you may unsubscribe now. | Email delivery powered by Google |
| Google Inc., 20 West Kinzie, Chicago IL USA 60610 | |
0 Comment for "Gold Weekly Nov 25-29/2013"